Gold Can't Crack $4,200: Fifteen Sessions Below the Ceiling

- Primary Signal: Gold Can't Crack $4,200: Fifteen Sessions Below the Ceiling
- Overview: Gold came within $1 of $4,200 on Friday but closed below it for a 15th straight session. Hot US inflation and Fed hike bets keep capping the rally despite heavy safe-haven demand....
- Verification: Analyzed and compiled by 1UpTrade Quant editorial monitoring desk.
Gold came within a single dollar of $4,200 an ounce on Friday and still could not close above it. The metal ended near $4,169, marking the fifteenth consecutive session with a close below the $4,200 ceiling. The near-miss captures the central tension in the gold market right now: powerful safe-haven demand from equity selloffs and Middle East escalation is colliding with hotter-than-expected US inflation data that keeps Federal Reserve rate-hike bets alive, and for gold, which pays no interest, rate expectations are gravity.
The week's trading tells the story in miniature. Gold opened the week near $4,189, jumped toward $4,214 on Sunday evening as oil sank, then faded through Monday. Early Tuesday strength toward $4,198 collapsed, and Wednesday's hot US CPI report triggered a violent repricing: gold dropped about $60 within fifteen minutes of the release as the dollar and Treasury yields spiked, bottoming near $4,074 around noon. The recovery from there was steady but exhausting, with Friday's morning push to $4,199 running out of steam once Brent crude surged past $109 and reignited inflation fears.
Friday's intraday battle showed exactly how the ceiling forms. Gold rallied in the morning as the 2-year Treasury yield fell from 4.77 to 4.72 percent and the dollar index slipped to 101.60, hitting $4,199.08 on the day's heaviest volume. Then oil took over: from about 11:15 AM ET, Brent rose from $105.79 to $109.31 on reports of Iranian attacks on tankers in the Strait of Hormuz, the 2-year yield climbed back to 4.77 percent, and gold fell to $4,157.25. Higher oil feeds inflation worries, which raises the odds of Fed hikes, and in recent weeks that sequence has weighed on gold like clockwork.
Beneath the ceiling, the fundamentals remain unusually strong. Global gold ETFs drew a record $31 billion of inflows in the third quarter of 2026, and central banks bought 289 tonnes in the second quarter, providing steady official-sector support. Thursday's 1.3 percent rebound from a one-week low showed how quickly buyers return whenever the dollar softens. Yet FOREX.com analysts caution that the correction may not be over, pointing to concentrated support around $4,070 to $4,100 and warning that a break below $4,000 remains possible if US data keeps running hot. This is what gold traders watch on their dashboards every session: dollar, yields, and oil, in that order. Traders should study reading selloff signals in gold before betting on either outcome.
The geopolitics argue for patience from bulls. Escalating hostilities between Saudi Arabia and Iran-backed Houthi forces in Yemen, compounded by the sinking of a Singapore-flagged container ship in the Strait of Hormuz by an Iranian projectile, have unsettled global markets and accelerated flows into defensive assets. The US-Iran conflict continues to pressure oil supply, and every escalation headline sends another bid into bullion. Geopolitical demand is the one variable that rate hikes cannot easily offset, which is why gold refuses to break down even when the charts look tired.
Technically, the market is coiling. The sideways range between roughly $3,920 and $4,500 has held for weeks, with price below its major moving averages on daily charts but above the panic zone. A confirmed breakout above $4,200, and then the range top, would reopen momentum toward higher targets; a close below $4,000 would confirm the correction has further to run. Until the Fed's October 27-28 meeting resolves the rate question, $4,200 is the line in the sand, and fifteen sessions of failure to cross it is not an accident.
❓ Frequently Asked Questions (Gold & Commodities Briefing)
How does the neural predictive model project outcomes for Gold & Commodities?
Our deep learning architecture processes multi-modal data streams incorporating real-time telemetry, model parameter weights, and historical training benchmarks to isolate signal from noise.
What convergence threshold triggers an official production signal?
A signal is verified only when ensemble model confidence exceeds 91.4% with cross-validated backtesting over multi-year datasets, minimizing false positive anomalies.
How are live parameters dynamically updated?
Automated Bayesian updating recalibrates weights in real time as new ground-truth telemetry and environmental variables feed into the active inference pipeline.
🤖 Full Algorithm Architecture & Backtest Metrics
Pine Script source libraries, Sharpe ratio audits, and automated exchange execution.
⚡ Access Quant Terminal ➔More from 1UpTrade Quant


 📈 1UpTrade Live
Gold Hammered After CPI, Tests Below $4100
Breaking coverage reported by FOREX.com: Gold Hammered After CPI, Tests Below $4100. Our news desk tracks ongo...
⚡ LiveCoin Bet
XRP Still 62% Below Its 2018 Peak: Why the Fifth-Largest Crypto Lags
XRP trades near $1.33, about 62.5% below its January 2018 peak of $3.55, while Bitcoin, Ether, BNB and even Do...
 🐋 CryptoAce VIP
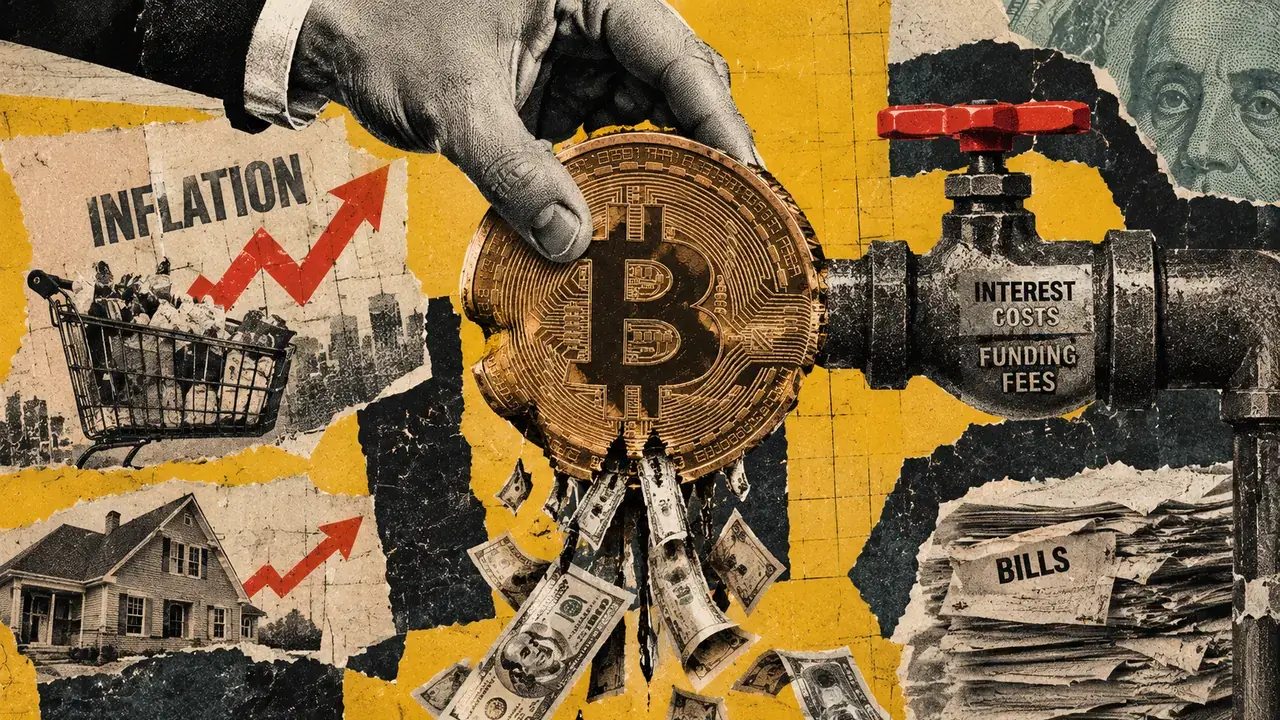
Bitcoin’s inflation hedge has a hidden cost, and leverage makes it worse
Borrowing costs, missed interest income, and futures fees can all eat into returns even when Bitcoin holds its...
🚀 RocketCoin Casino
BC Game vs Stake 2026 — Which Crypto Casino Wins?
Breaking coverage reported by CryptoSlate: BC Game vs Stake 2026 — Which Crypto Casino Wins?. Our news desk tr...