Trading Bot Performance Metrics Explained: Win Rate, Profit Factor and Sharpe
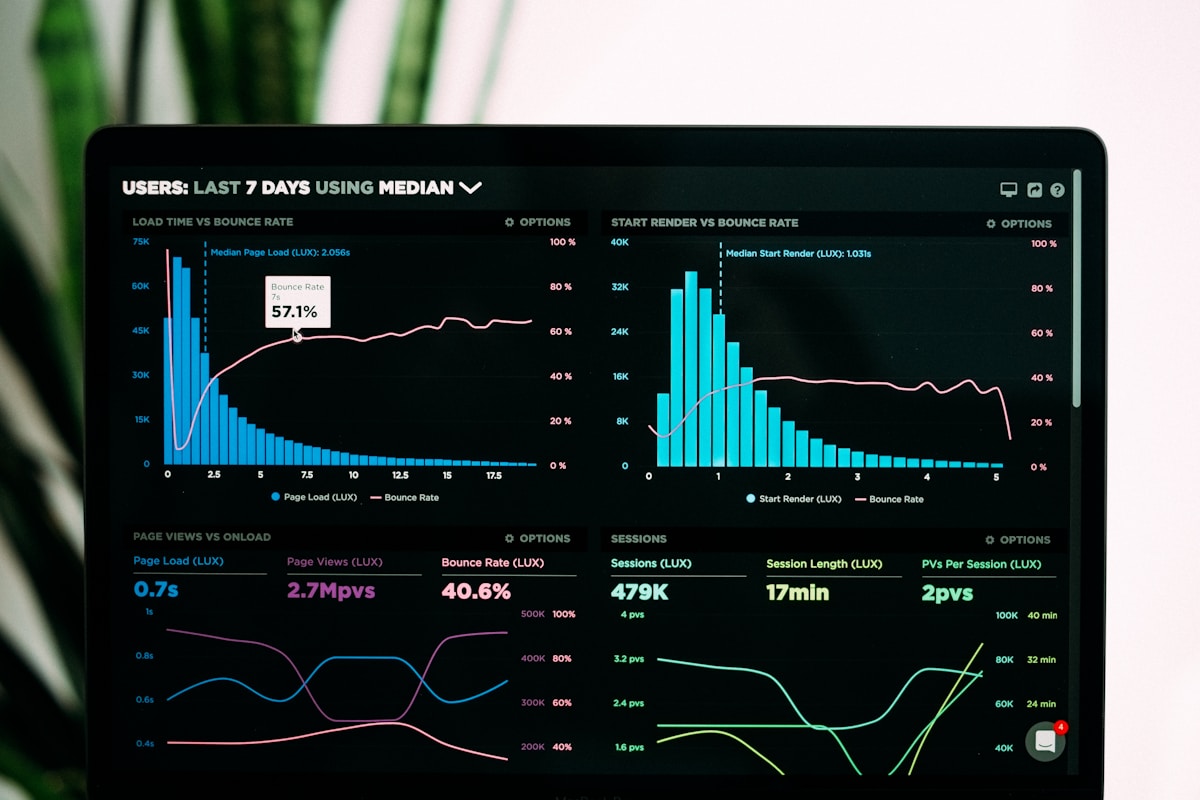
- Primary Signal: Trading Bot Performance Metrics Explained: Win Rate, Profit Factor and Sharpe
- Overview: Bot dashboards flood you with numbers — win rate, profit factor, Sharpe ratio, drawdown. Learn what each metric actually tells you and which ones matter most before trusting a bot....
- Verification: Analyzed and compiled by 1UpTrade Quant editorial monitoring desk.
Trading bot dashboards present a wall of metrics, and beginners often fixate on the most flattering one — usually win rate or total return — while ignoring the numbers that reveal risk. Understanding a handful of key metrics lets you compare bots honestly, spot marketing tricks, and decide whether a strategy deserves your capital. The goal is not to memorise formulas but to know what each number can and cannot tell you. Dashboards sometimes annualise short-term returns, which can make a lucky month look like a spectacular yearly rate, so always check the actual period behind any annualised figure.
Win rate is simply the percentage of trades that close in profit. It feels intuitive, but it is dangerously incomplete on its own. A bot with a ninety percent win rate can still lose money if its few losses are enormous, while a bot with a forty percent win rate can be highly profitable if its winners are much larger than its losers. Always read win rate together with average win and average loss — the trio tells you far more than any single figure. The Calmar ratio, which compares annual return with maximum drawdown, is another useful lens, since it directly answers how much return you received for enduring the worst fall.
Profit factor is a stronger summary: total profit from winning trades divided by total loss from losing trades. A profit factor above one means the strategy makes more than it loses, and values well above one suggest a comfortable edge. But profit factor can be inflated by a single huge winner, so check it alongside the number of trades — a profit factor built on hundreds of trades is far more trustworthy than one built on a dozen lucky ones. Trade count deserves emphasis in every evaluation: metrics computed from thousands of trades are statistically meaningful, while metrics from a handful of trades are mostly noise.
Expectancy translates metrics into a per-trade figure: the average amount you expect to gain or lose each time the bot trades. Positive expectancy is the fundamental requirement of any strategy worth running. It combines win rate, average win and average loss into one number, and it lets you estimate long-run results: multiply expectancy by expected trade frequency and you get a rough sense of what the bot might earn — or cost — over time. Be wary of bots whose equity curve rises in an almost perfectly straight line, since real trading always includes rough patches, and suspicious smoothness can indicate fabricated or curve-fitted results.
Risk-adjusted metrics ask a different question: how much return did the bot earn for the risk it took? The Sharpe ratio compares returns against their volatility, rewarding smooth, steady gains over wild swings. A bot with modest but steady returns often has a better Sharpe ratio than a bot with spectacular but erratic returns. For traders who value sleep and stability, risk-adjusted numbers matter more than headline returns. Benchmarking against a simple alternative, such as holding the underlying asset, reveals whether a bot's complexity earns its keep or merely adds fees and moving parts.
Maximum drawdown belongs in every evaluation. It measures the worst peak-to-trough fall in equity and tells you what kind of losing period you must be prepared to sit through. A bot with great returns but a forty percent historical drawdown demands extraordinary discipline; most traders would switch it off at the worst moment. Compare drawdown with return: a strategy earning solid returns with shallow drawdowns is usually a better choice than a flashier one with deep ones. Metrics should be rechecked after any strategy update, because a change intended to improve returns can quietly worsen drawdown or win rate in ways that only the numbers reveal.
Use metrics as a checklist, not a verdict. Demand a reasonable trade count, positive expectancy, a profit factor comfortably above one, and a drawdown you can tolerate emotionally. Be suspicious of any bot advertising a single dazzling metric while hiding the rest, and always prefer metrics from forward-tested or live results over backtests alone. Numbers do not remove judgement, but the right numbers make judgement far more reliable. In the end, metrics are decision aids, not decisions themselves: combine them with your own tolerance for risk, your time horizon, and your confidence in the strategy's logic.
📖 Continue Reading the Full Story
Continue reading this article on 1UpTrade Quant.
⚡ Access Full Content NowMore from 1UpTrade Quant



 📈 FreeRich FIRE
How Do Prop Trading Firms Handle Applicant and Partner Calls Around the Clock?
Prop firms attract global applicants across every time zone. Here's how an AI receptionist answers in your bra...
 📊 Try2Rich Capital
Strategic Blueprint: Desi Shop Khata, Profit & School Fee Calculator (PKR) (Day 6 Guide)
Unlocking high-yield efficiency through Desi Shop Khata, Profit & School Fee Calculator (PKR) on Try2Rich Capi...
 🚀 RocketCoin Casino
Strategic Positioning: Typing Speed Test — WPM & Accuracy Test Online (Day 26 Guide)
Gaining a competitive advantage through Typing Speed Test — WPM & Accuracy Test Online on RocketCoin Casino. D...
 ⚡ LiveCoin Bet
Strategic Blueprint: Parlay Calculator — Gecombineerde Odds en Uitbetaling (Day 6 Guide)
Unlocking high-yield efficiency through Parlay Calculator — Gecombineerde Odds en Uitbetaling on LiveCoin Bet....